Technical Analysis: LFEX Norway Exporters Salmon Index, 9th June 2023

David Nye - The London Fish Exchange

Published: 12th June 2023

This Article was Written by: David Nye - The London Fish Exchange


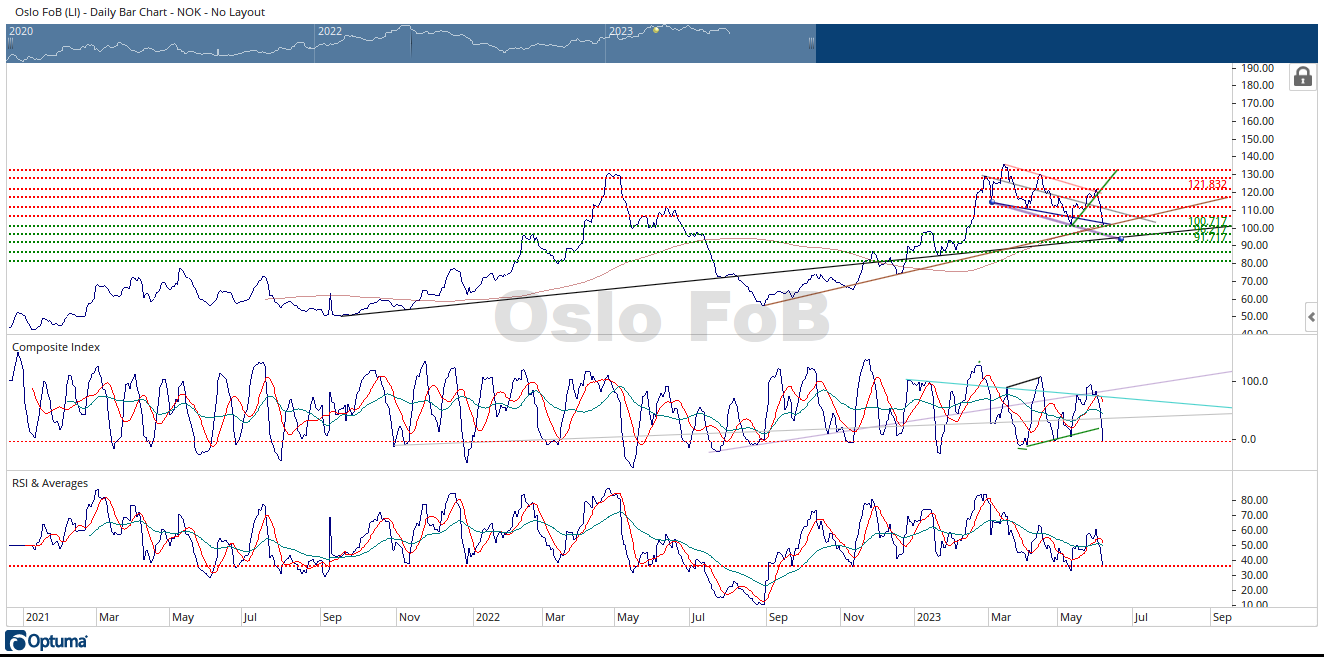
The Oslo FoB Index fell 14.4% during the last week of trading. The Oslo FoB Index rallied to and failed at the red down sloping trendline and the 121.83 NOK horizontal resistance zone.

When the Oslo FoB Index broke through the green upsloping trendline, it was confirmation that the Oslo FoB Index price was heading lower. There is a horizontal support zone at 100.71 NOK and 96.21 NOK.

I reintroduced the tan upsloping trendline back into view that could offer support in this price area. The black upsloping trendline could offer support for the Oslo FoB Index in the mid 90’s NOK. It will be interesting to see if the Oslo FoB Index can make a higher low vs the May 11th 101.35 NOK low. I included two down sloping trendlines that connect prior lows into the chart. The blue down sloping trendline is very near this price area and could offer support.

The Composite Index crashed through both of it’s moving averages. In one week, the Composite Index fell from a high displacement down to the lower end of its displacement range. The moving averages are now converging. The Composite Index has a significant amount of history near its current displacement. This displacement has been mostly used as bottoms for the Composite Index or minor resistance for form a W double bottom pattern in the Composite Index. At the same time, the Composite Index does have room to move lower.

The RSI failed testing of the positive displacement of its moving averages. The RSI also failed below the 65(ish) displacement area, raising the odds that the Oslo FoB Index is in a bear market. The RSI has also moved to the lower end of its displacement history during the last week. The RSI did bounce a few times near this displacement area during the last downtrend in mid-2022. The next week or two are important for the Oslo FoB Index. If the Oslo FoB Index is still in a bull market the RSI needs to turn higher very quickly and it would be encouraging to see the Oslo FoB Index hold the 100.17 NOK support zone. If the Oslo FoB Index is in a bear market, I’d expect the 100.17 support zone to fail so the Index can continue to make lower lows and lower highs in price.

  About This Analysis

About David Nye

David is a Senior Vice President in investment advisory with over 30 years of experience.

Based in Minnesota, USA he has a long history in technical analysis across a range of markets. David brings his experience to provide an independent insight into potential salmon pricing based on LFEX and DataSalmon data.

What is Technical Analysis?

Technical Analysis is used to try and identify price trends in the future. Analysts believe that by using factual past information (trading activity and price changes) it is possible to identify future price movement trends and is quite prevalent in commodity and forex markets but can be applied to any product.

Technical Analysis has been developing for over a century, and there are now hundreds of patterns and signals that have been created. They are often used in conjunction with other forms of research and analysis to help formulate, or support pricing trend opinions.

Purpose of the Analysis?

To provide an independent data-driven view of market pricing trends in the short and medium-term. As a potential tool, for users to access future pricing trends based on LFEX/DataSalmon derived market data.

How Does it Work?

On a regular basis (weekly), David will provide his independent analysis of LFEX and DataSalmon pricing data. The output will be to provide pricing trends based on the most up to date pricing received.

The analysis will show the expected trends and potential (price) levels, as well as other markers – for example, higher or lower price triggers that would affect the analysis of the trend – and what this might mean. It is data-driven, and will not, and does not, account for any other fundamental analysis, or weather or biological events for example. This is the same for any commodity product technical analysis.

Disclaimer

All information provided contains no guarantee whatsoever, especially of completeness, accuracy, timeliness or of the results obtained from the use of this information, and is provided without warranty of any kind, expressly or implied. In no event will, LFEX Ltd or DataSalmon, its member firms, or the partners, directors, officers, owners, agents or employees thereof be liable to you or anyone else for any decision made or action taken in reliance on the information or for any consequential, special or similar damages, even if advised of the possibility of such damages. In no event and under no legal or equitable theory, whether in tort, contract, strict liability or otherwise, shall LFEX Ltd or DataSalmon be liable for any direct, indirect, special, incidental or consequential damages arising out of any use of the information contained herein, including, without limitation, damages for lost profits, loss of goodwill, loss of data, work stoppage, the accuracy of results, or computer failure or malfunction