The London Fish Exchange
Data / Market Insight / News
Technical Analysis: LFEX Norway Exporters Salmon Index, 8th December 2023
|
|
Published: 11th December 2023 This Article was Written by: David Nye - The London Fish Exchange |
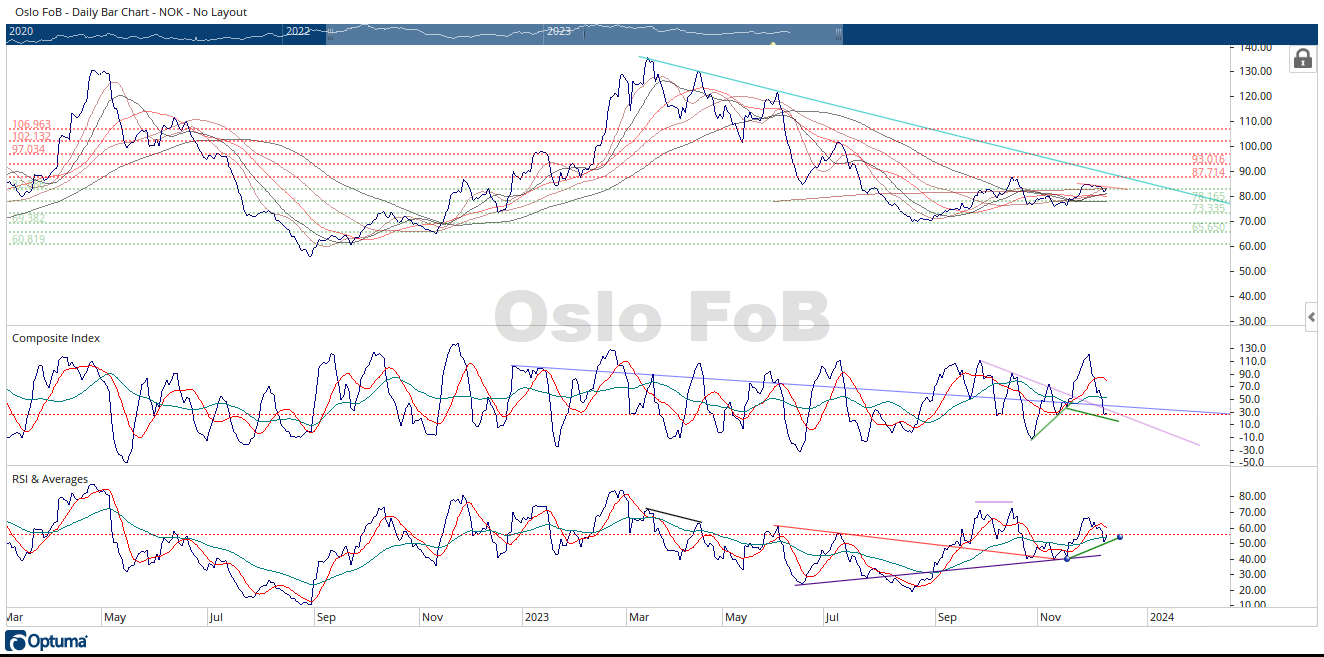
The Oslo FoB Index had another quiet week of trading. The Oslo FoB Index fell 1.68% from last Friday’s close.
I drew in a light red trendline above the recent price highs on the Oslo FoB Index chart. Breaking above this light red trendline would be an early sign that the Oslo FoB Index is starting its next to move to higher prices. The next support zone is at 78.16 NOK. Notice there is a price moving average at 76.18 NOK and three price moving averages between the Oslo FoB Index’s current price and the next horizontal support zone. The price moving averages should offer additional support for the Oslo FoB Index.The sideways price action the last few weeks doesn’t give much new data to comment on.
The first thing I noticed looking at the chart is how much the Composite Index and the RSI indicators have reset lower while the price of the Oslo FoB Index grinds sideways. This is usually a bullish sign. The indicators are resetting lower to make another move up while prices grind sideways. The Composite Index is at the same displacement that started rallies in early October and November of 2023.
The RSI is continuing to operate in a bullish displacement zone. The RSI bounced near its slow-moving average and off the displacement high from early November 2023. The RSI doesn’t have a lot of current history at its current displacement except for the high it made at this displacement around July 10th, 2023. I drew in a green up sloping trend line on the RSI from the last low to its current displacement. I also drew a down sloping trendline during the same time period on the Composite Index. This is bullish divergence on the indicators. The Composite Index is more over sold at higher Oslo FoB Index prices. This is usually also a bullish development.
As mentioned earlier, with the limited price movement, I don’t have a lot more information to bring to the table. In my humble opinion, the Oslo FoB Index is displaying bullish characteristics.
|