Technical Analysis: LFEX Norway Exporters Salmon Index, 4th April 2024
|
|
Published: 8th April 2024
This Article was Written by: David Nye - The London Fish Exchange
Technincal Analysis
|
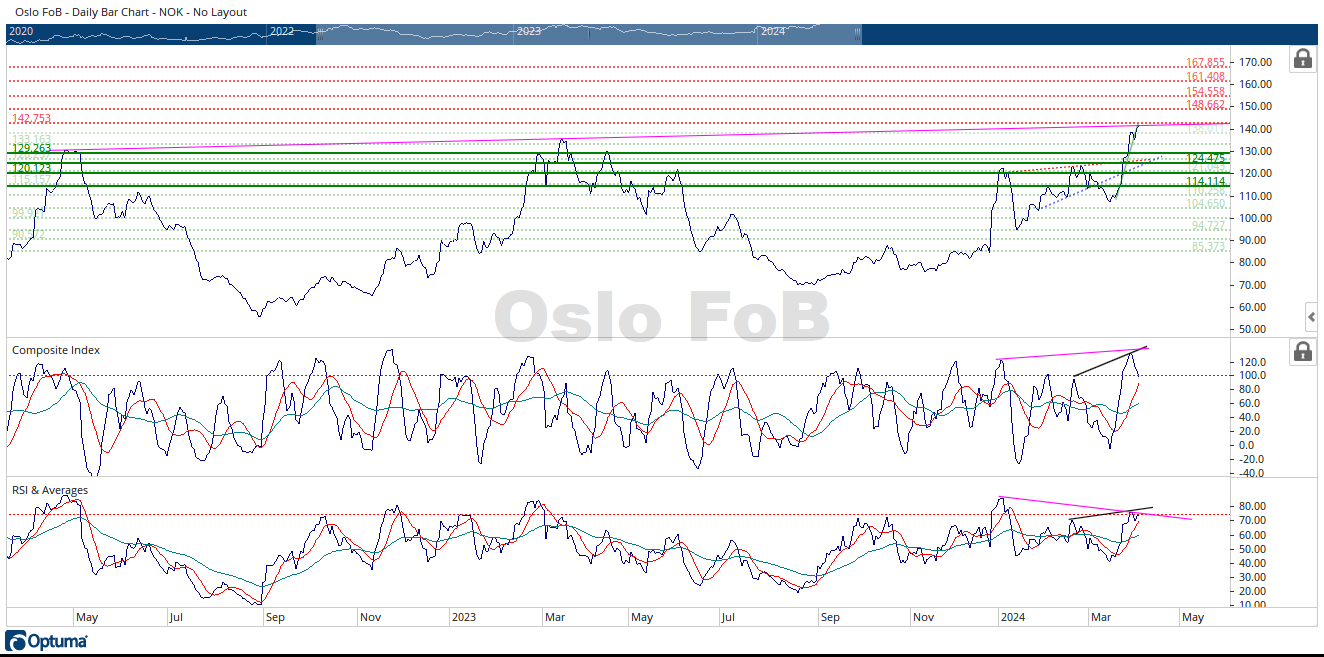
The Oslo Fob Index rallied 1.73% from Wednesday April 27 through Friday April 5th. The Oslo FoB Index is testing the pink resistance line that connects the last two years highs and the underside of the 142.75 NOK horizontal resistance zone.
I’m impressed the Oslo Fob Index is holding the steep uptrend angle represented by the green trendline connected to the recent prices. I mentioned in a previous update that I had several different techniques pointing towards the 142.75 NOK price as a resistance target. I’d think the pink trendline connecting the previous years highs and on top of the 142.75 NOK horizontal resistance zone would be strong enough to slow the steep ascent. We are going to find out if the Oslo Fob Index has enough energy to keep moving higher.
I reworked the support and resistance zones using two different techniques represented by horizontal green solid and dashed lines. The red dotted lines are the price resistance zones.
The Composite Index is showing bearish divergence with the Oslo FoB Index. Since the most recent high in the Composite Index, the Composite displacement is going down while the Oslo Fob Index heading higher. The Composite Index has used its current displacement as resistance, but I don’t see the Composite Index using this displacement as support in the available history. The likely near-term target is the fast red moving average. Notice the moving averages on the Composite Index now have a positive displacement and they are diverging. The Composite Index is going down to possibly test the positive crossover.
The RSI is also showing bearish divergence with Oslo Fob Index. This is a concerning development if you’re looking for higher prices. The RSI isn’t great a tool for showing divergence at turns. The fact the RSI is diverging with the Oslo FoB Index should get your attention. The RSI is also testing the underside of the pink trendline connecting a prior bearish divergence signal. This is additional resistance for the RSI. Like the Composite Index, the RSI is moving down to test the positive crossover of its moving averages. The moving averages are also diverging.
If you look closely at the last three days of trading, the Composite Index is moving down, while the RSI is moving up, more bearish short-term divergence.
In summary, the Oslo FoB Index has both some bullish and bearish developments. The bullish case is the Oslo Fob Index is climbing at a very steep angle, which is a sign of strength. The moving averages on the indicators now have a positive displacement. If the indicators can bounce back up after testing the positive crossover of their moving averages, this usually signals another strong move up in prices.
The bearish case is the Oslo FoB Index is it is testing a pink trendline that connects the past two years highs. It is also close to testing the 142.75 NOK horizonal resistance zone. The steep angle the Oslo FoB Index is using for its rally is unsustainable for a long period of time. There is bearish divergence in both indicators. More troubling is the RSI is also diverging the Oslo Fob Index. The Oslo FoB Index has made modestly higher highs the last two years. So far this year, the Oslo FoB Index has just made another modestly higher high from prior years highs.
Breaking the green steep uptrend line will be the one of the first signs the rally is losing momentum. The logical downside short term target is the 124.47 NOK and 126.32 NOK horizontal trendlines. The reason I’m suggesting this price area is there are two different support techniques overlapping in this price area. This price area also has the pink dotted upward sloping trendline and the blue dotted trendlines intersecting in this price area.