The London Fish Exchange
Data / Market Insight / News
Technical Analysis: LFEX Norway Exporters Salmon Index, 30th May 2025
|
|
Published: 2nd June 2025 This Article was Written by: David Nye - The London Fish Exchange |
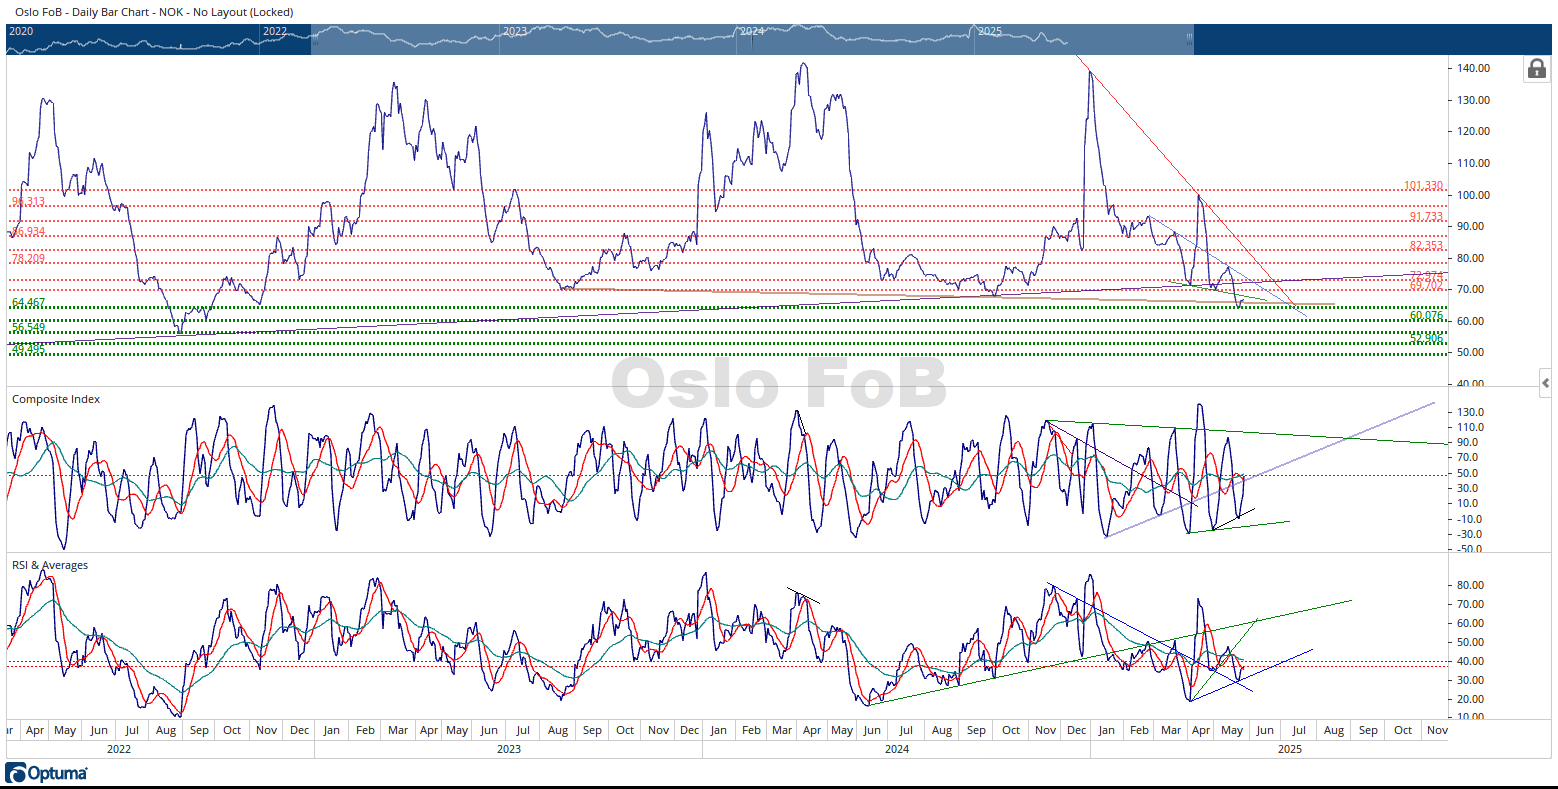
The Oslo FoB Index rallied 4.43% this week to finish the week at 67.07 NOK. The 64.46 NOK horizontal support zone and the brown trendline that connects the previous two years price lows appears to have slowed down the decline of the Oslo FoB Index.
I reintroduced a couple of trendlines drawn on the chart that were used as prior support or resistance. These trendlines can also influence the Oslo FoB Index when tested again. The first obvious resistance test will be the green downward sloping trendlines that connected the prior two price lows. Then the 69.70 NOK horizontal resistance zone would be the next area of price resistance.
The Composite Index has rallied up and is currently testing the negative crossover of its moving averages. This signal is concerning because the validity of the signal increases when the Oslo FoB Index is in a downtrend. The other concerning development is how far the Composite Index displacement has risen with a small corresponding move in the Oslo FoB Index.
The RSI is close to testing the negative crossover of its moving averages. The RSI has broken above its fast-moving average late this week. The RSI has run into strong resistance around the 50-displacement area since January 2025. The RSI has also used its current displacement area as support during the same time. This means the RSI can also use this displacement area as resistance.
In summary, this update is brief. The main reason is with the small price movement of the Index. As usual, there are some bullish and bearish developments on the chart. The Oslo FoB Index has experienced a sharp sell off during the past five months, meaning it can certainly keep rallying higher. The Index usually makes its seasonal lows during August, September or October of each year. Meaning, if this the start of a price rally, it will likely be a corrective rally in a downtrend.
|