Technical Analysis: LFEX Norway Exporters Salmon Index, 28th March 2024
|
|
Published: 3rd April 2024
This Article was Written by: David Nye - The London Fish Exchange
Technincal Analysis
|
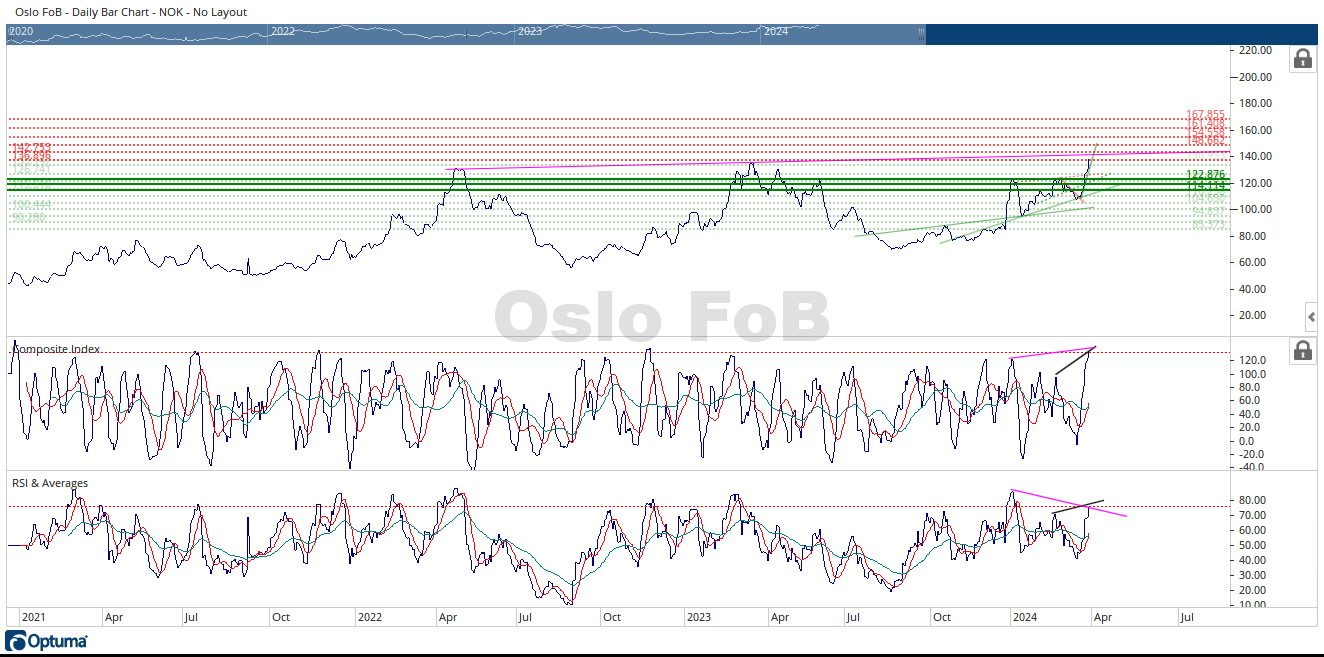
The Oslo FoB Index rallied 19% during this holiday shortened week of trading. The 138.09 NOK is an all-time high price within the available historical data for the Oslo FoB Index.
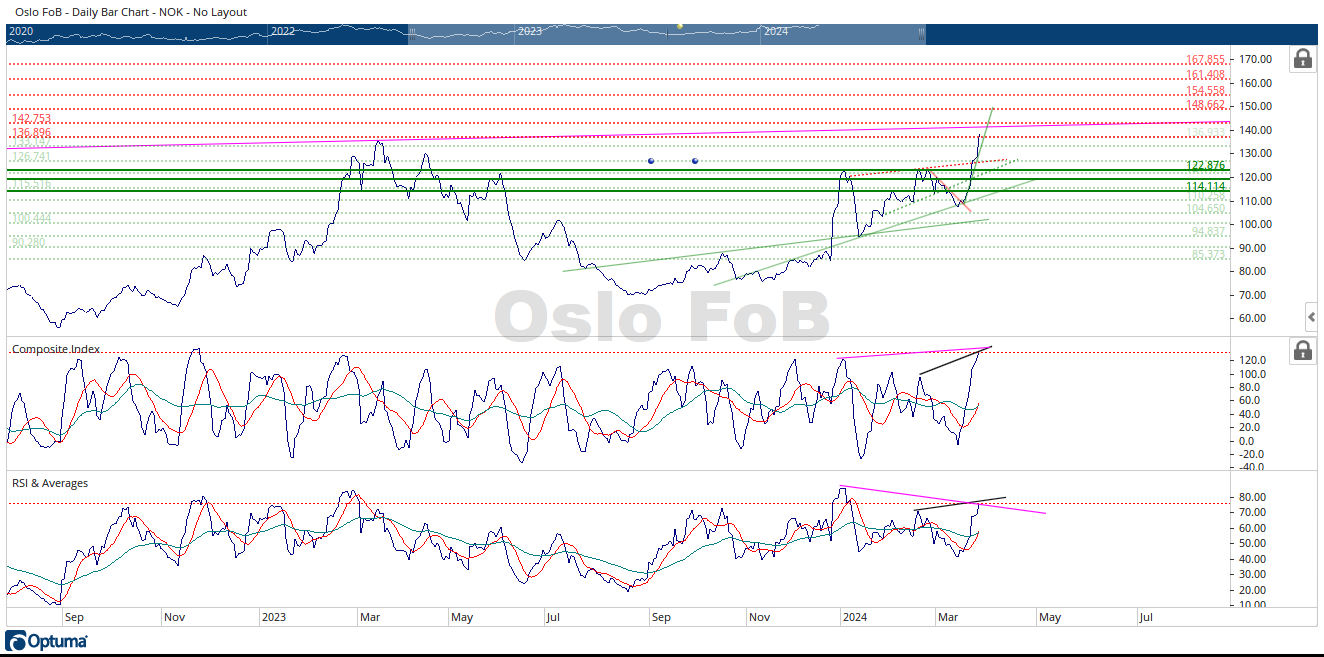
The trend of making higher highs each year during the March to May time periods is continuing. The pink sold trendline connecting the price highs from 2022 and 2023 is still a valid target. Currently the 142.75 NOK horizontal dotted resistance zone and the pink upward sloping trendline are near the same price. This trendline should offer additional resistance for the Oslo FoB Index. Notice the steep ascent of the most recent rally. Steep angles imply strong moves. The pink upward sloping dotted trendline that is connecting the most recent highs from early January to late February 2024 and the dotted green upward sloping trendline should offer support in addition to the dotted horizontal support zone near the 126.74 NOK price area.
I updated the support and resistance zones using dotted horizontal lines. The method used to create the dotted green support zones isn’t as useful of a tool when the security goes into all-time high prices. I included a different technique to find support that works in this situation. They are represented by solid green horizontal lines. Notice how far away the first solid green support zone is under current prices. Both techniques are showing some confluence of support near the 115 NOK and 122 NOK price areas.
The Composite Index is at a new displacement high during this rally that started in the August of 2023. Looking back through the available historical data, the Composite Index has only been at this high of a displacement four other times. Only one of these four displacement highs turned out to be the end of the rally. The Composite Index needs to reset down to a lower displacement but the price highs for the Oslo FoB Index are likely not in. I’d expect the Composite Index to reset and then make another rally. The Composite Index should make a lower displacement high while the Oslo FoB Index makes a higher price high. This would give a bearish divergence signal and give us a clue as to when the trend is weakening.
The RSI is also at the higher end of its historical displacement range and still has some room to move higher. The shorter-term divergence signal that was represented in last week’s update has been resolved, represented by the black upward sloping trendlines on the indicators. There is another bearish longer term divergence signal, represented by the pink trendlines on the indicators. This pink divergence signal is over a longer time period and these longer term signals have a tendency to lose their strength over time.
In summary, the prices for the Oslo FoB Index need to retrace or rest along with the two indicators. Based on the Composite Index’s current displacement, I don’t think the high prices are in for the Oslo FoB Index. At some resistance zone, we should see the Oslo FoB Index pullback, make a higher price low and then make a higher price high while the Composite Index makes a lower displacement high. This will help determine when the trend is losing momentum. I also drew in a green steep upward sloping trendline connecting the recent lows. The first sign the trend is weakening is breaking below this steep green trendline.
I included two charts for your review this week. The longer-term chart to help you see the displacement range in the Composite Index and the RSI. A shorter-term chart to help see more of the finer details.