The London Fish Exchange
Data / Market Insight / News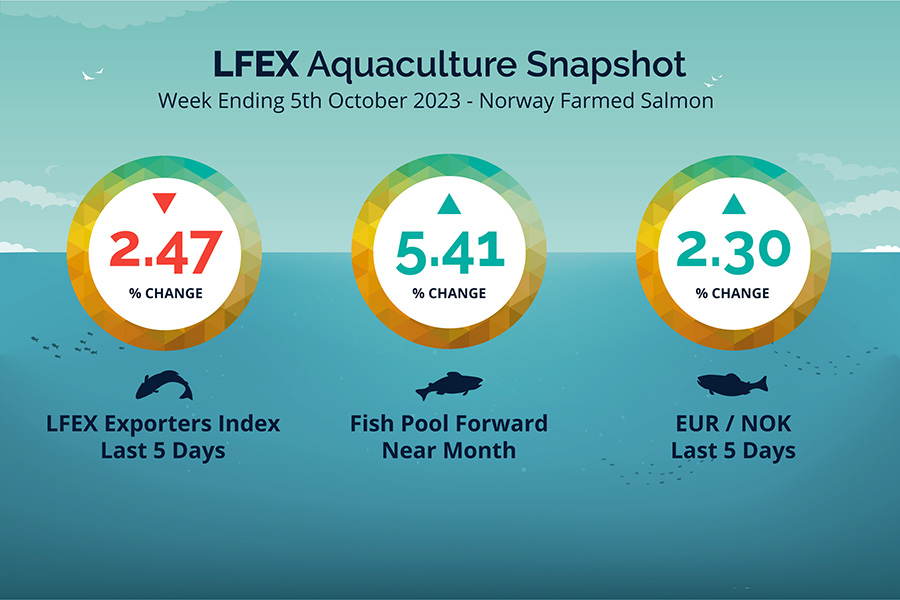
LFEX European Aquaculture Snapshot to 5th October, 2023
|
|
Published: 6th October 2023 This Article was Written by: John Ersser |
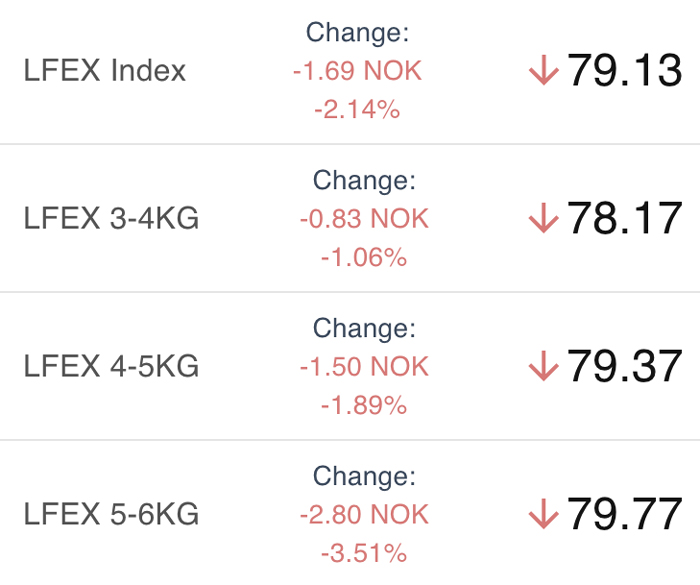
The LFEX Norwegian Exporters Index for Week 40 2023 was down -2.47%, -2.00 NOK to stand at 79.13 NOK (approximately 6.83 EUR) FCA Oslo Week ending Thursday vs previous Thursday.
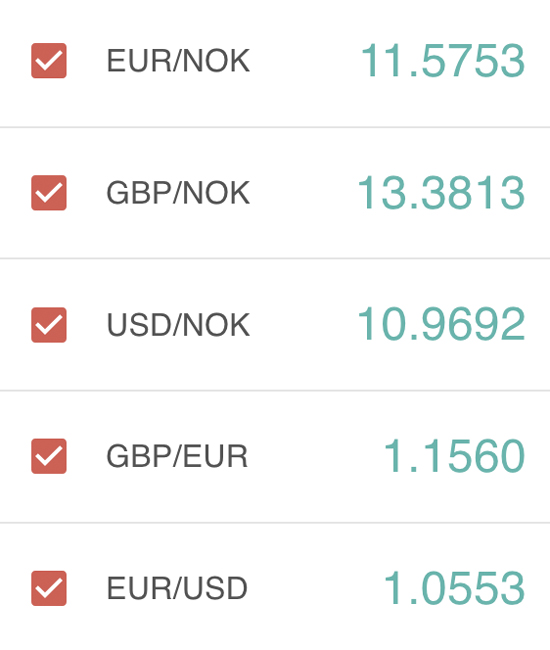
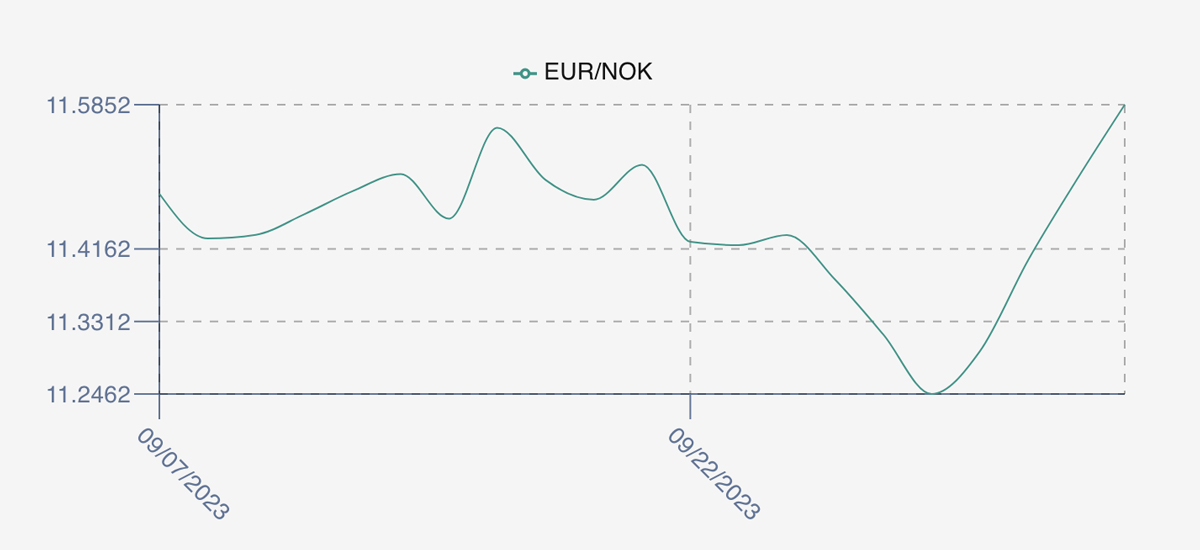
The NOK rate was jumped back to 11.58 to the Euro over the period Thursday to Thursday +0.26 NOK or +2.30%. The Fish Pool future October was reported up +4.00 NOK, +5.41% at 78 NOK.
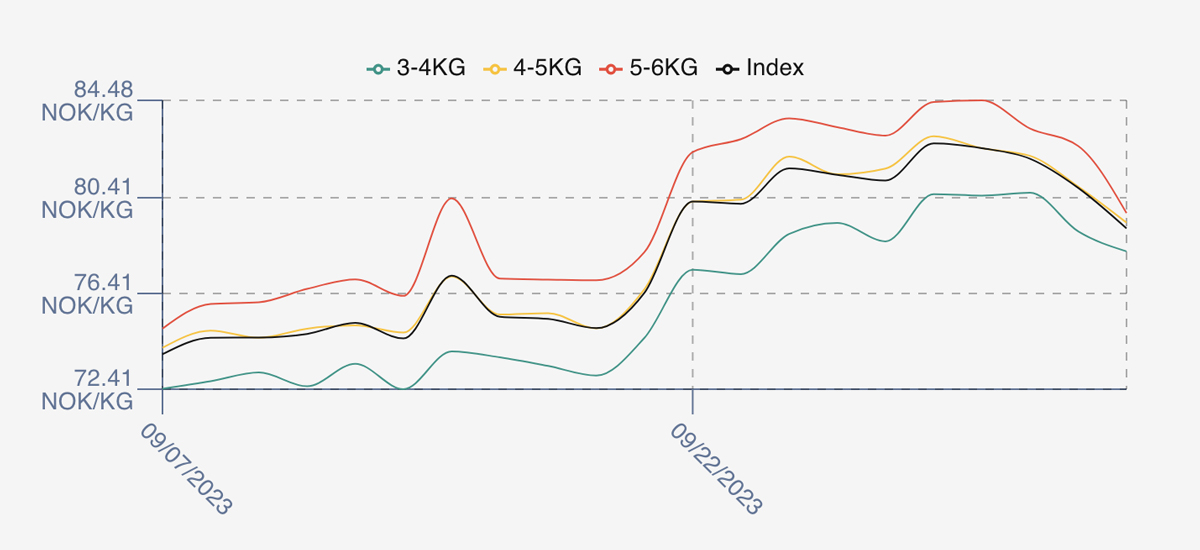
Index prices opened up to the good last Friday +1.55 NOK / +1.87% at 82.68 pretty close to the early market indications around 82.5. Overall weakness in the underlying biomass price brought levels down, supported by a weaker EURNOK which was off 2.3%, meaning Euro buyers saw an overall drop last week to Thursday of -4.66%. Monday was the peak at 82.48 and the week trailed off from there, with Tuesday showing 82.04, Wednesday 80.82 to close on the low at 79.13. Volumes for week 39 were 24,952. Next week prices are looking stable with initial indications around 77.5 / 79 / 79-80. No premiums for bigger fish due to more availability and less Far East demand. Good volumes available and pricing may be influenced by the underling frozen VAP market pricing which isn’t at a premium at the moment. We shall see.
David Nye’s technical analysis report will be published on Monday.
Market Data (Click Each to Expand)
LFEX Prices
|
FX Rates
|
LFEX Indicative Exporter Prices (4 Week)
|
EUR / NOK FX Rate (4 Week)
|
|
Prices Ending 5th October, 2023 For Friday's Price For Next Week, Offers & Trading Please Register |
Did You Know?
As a manager you can get a snapshot in moments of the activity in your business.
You can see all order histories with ease on the platform. You can sort and search and see who are the biggest parties, discover who is buying / selling at optimal prices, and identify those companies to focus more on and reduce supply shock exposure by evaluating history. It’s all at your fingertips.
FAQ’s
Q. How closely does your index track the market?
A. This is a good question. We pick-up sellers offered pricing for the index and so in theory the indicative index would be expected to be a little higher than the actual trades that go through. If we compare versus the NASDAQ 3-6’s we see that the index is around 1.2% higher over a longer-term average. However, our prices are a daily average price which seeks to pick-up intra week volatility as well as levels. The NASDAQ price is volume weighted, meaning that if 50% of the volume were traded on a Monday and then prices moved significantly during the week, that could account for a difference in levels. In week 39 the difference was 0.89%.