The London Fish Exchange
Data / Market Insight / News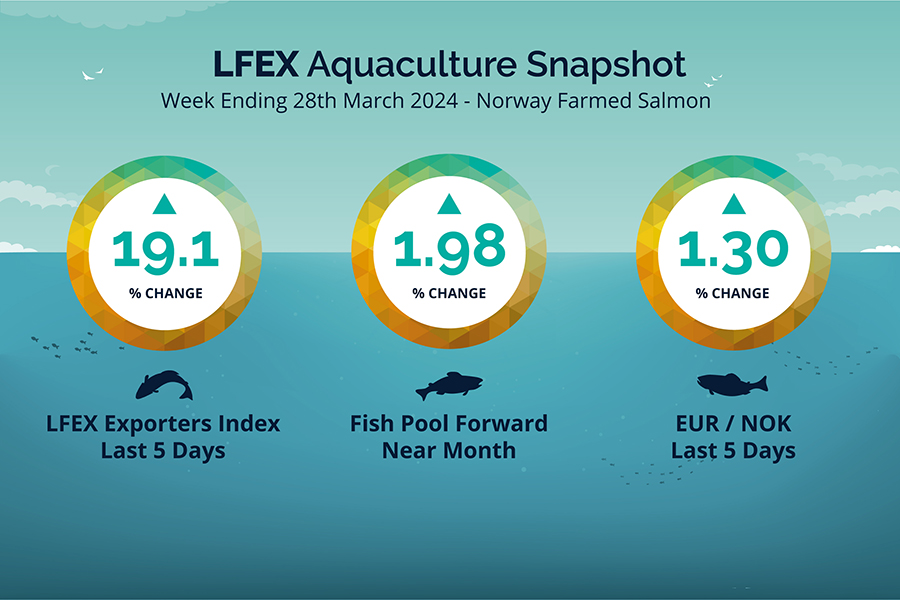
LFEX European Aquaculture Snapshot to 28th March, 2024
|
|
Published: 28th March 2024 This Article was Written by: John Ersser |
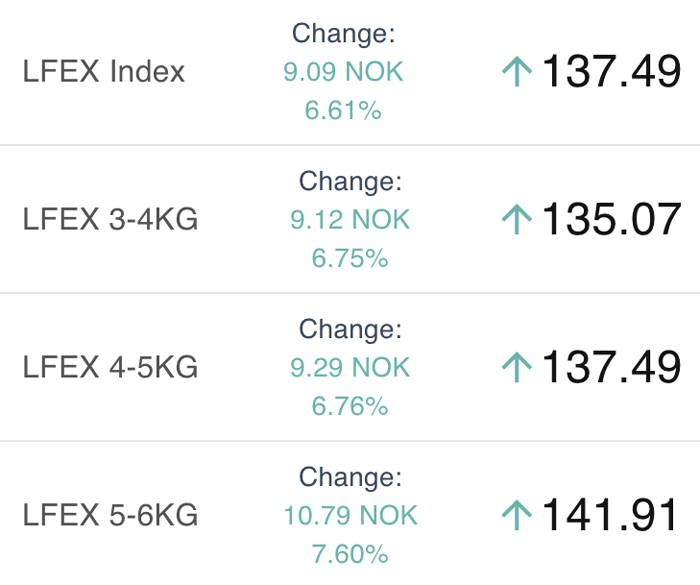
The LFEX Norwegian Exporters Index for Week 13 2024 ended the week up +19.12%, +22.07 NOK to stand at 137.49 NOK (in EUR terms 11.77 / +1.76 / + 14.96%) FCA Oslo Week ending WEDNESDAY vs previous Thursday.
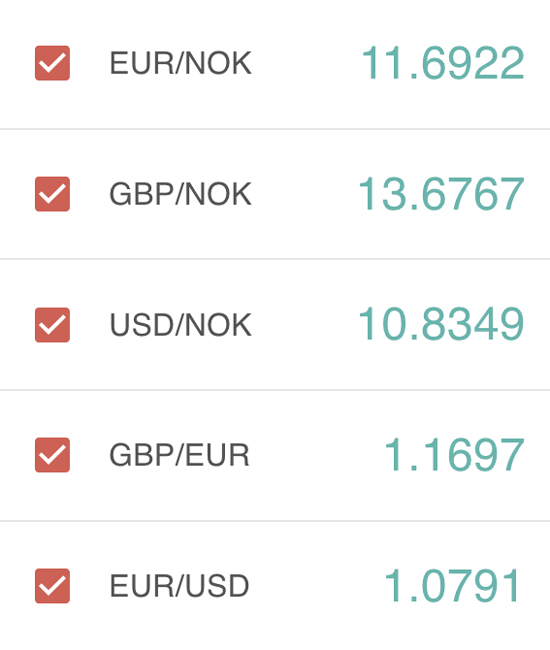
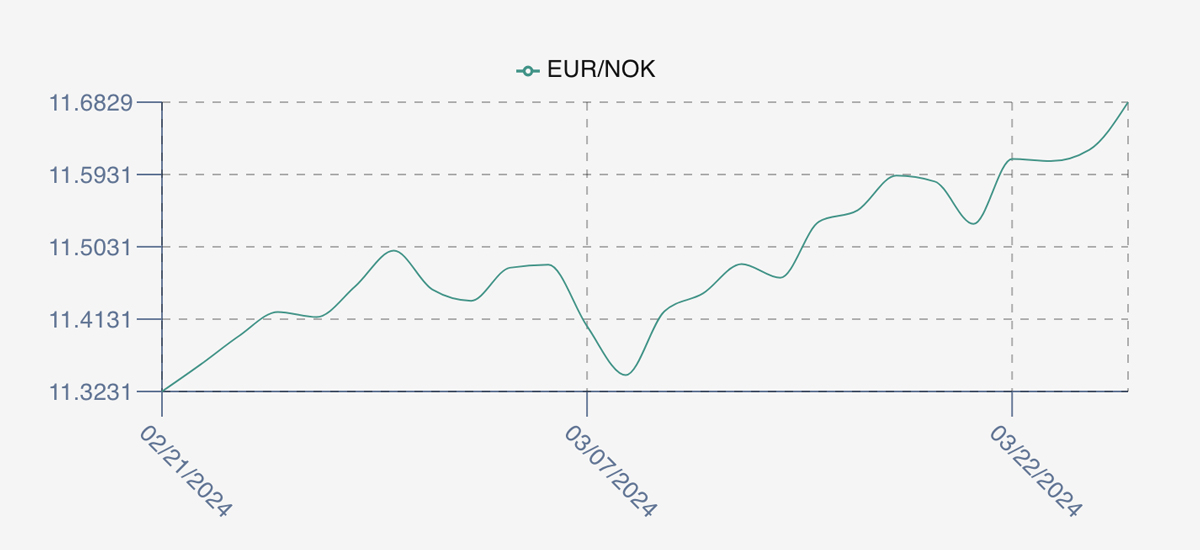
The NOK rate ended up at 11.68 to the Euro over the period Thursday to WEDNESDAY +0.15 NOK or +1.30%. The Fish Pool future March was reported up +2.20 NOK, +1.98% at 113.2 NOK with April showing 116.50.
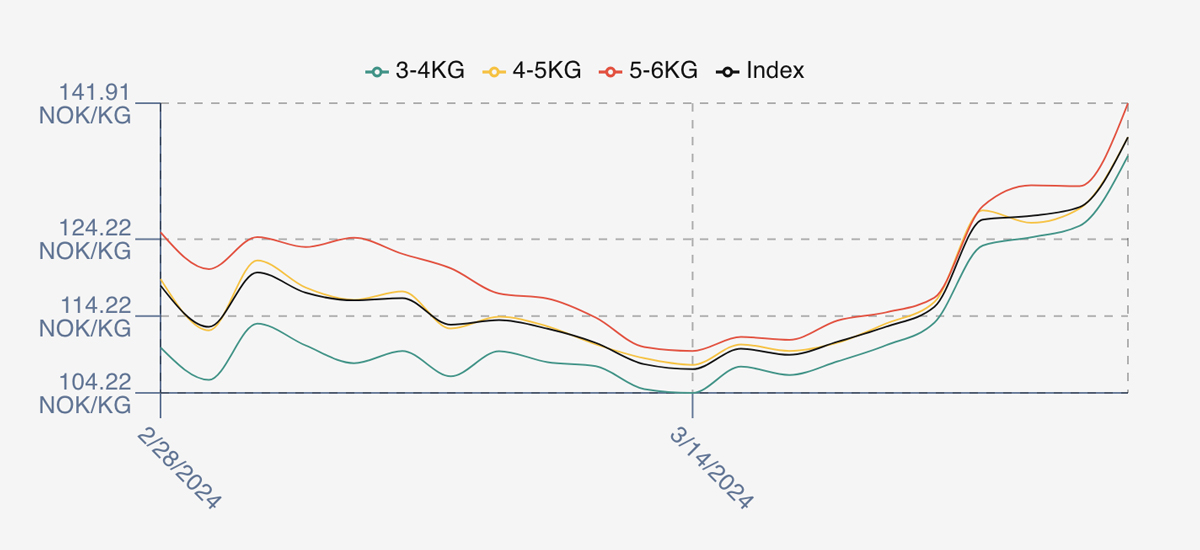
Last week (13) the index gapped up opening at 126.77 compared to the prior weeks close (115.42) which was the low of a dramatic week. Monday and Tuesday edged up further at 127.25 and 128.40 respectively. The end of the 3 days harvest week saw prices balloon to a huge 137.49.
Easter pressure and lack of superior pushed the market higher earlier in the week as expected. However, the jump on Wednesday related to a further lack of superior fish being available. Winter wounds which have been causing problems were exacerbated this week, with estimates of 80% of fish harvested being affected in a short harvesting week and demand in week 14.
Norway is off today but Wednesday’s price is looking like a good proxy for delivery for week 14 to kick off from. NOK weakness has helped European buyers a little.
By comparison week 15 2023 was the post Easter trading week (week 14 this year), and prices ended at 125.93 NOK. The EURONOK rates was 11.39.
David Nye’s technical analysis report will be published later today.
Market Data (Click Each to Expand)
LFEX Prices
|
FX Rates
|
LFEX Indicative Exporter Prices (4 Week)
|
EUR / NOK FX Rate (4 Week)
|
|
Prices Ending 28th March, 2024 For Friday's Price For Next Week, Offers & Trading Please Register |
Did You Know?
Technical analysis uses past prices to predict future price movements, while avoiding other informational inputs, to provide a pure technical view.
This can be used with other market information to inform participants on potential pricing movements. Last week (13) was a good example – ‘… The Oslo FoB Index also broke above the steep red downward sloping trendline. The string of lower lows and lower price highs has changed significantly during this week of trading. I’m seeing a confluence of price targets in the 130.96 NOK and 136.93 NOK price areas…’
FAQ’s
Q. What is The Composite Index used in technical analysis?
A. It was developed by Constance Brown to fix a problem traders and asset manager were experiencing with the existing Relative Strength Index, which frequently failed to show any divergence where markets were flatter, and therefore missed trend reversals. By imbedding a Momentum formula within the Relative Strength Index, Constance showed a significantly improved trend reversal signal and timing characteristics. David Nye uses the Composite Index (amongst other studies) for his fascinating technical analysis views on the Norwegian salmon markets published weekly.
Have a Happy Easter!