The London Fish Exchange
Data / Market Insight / News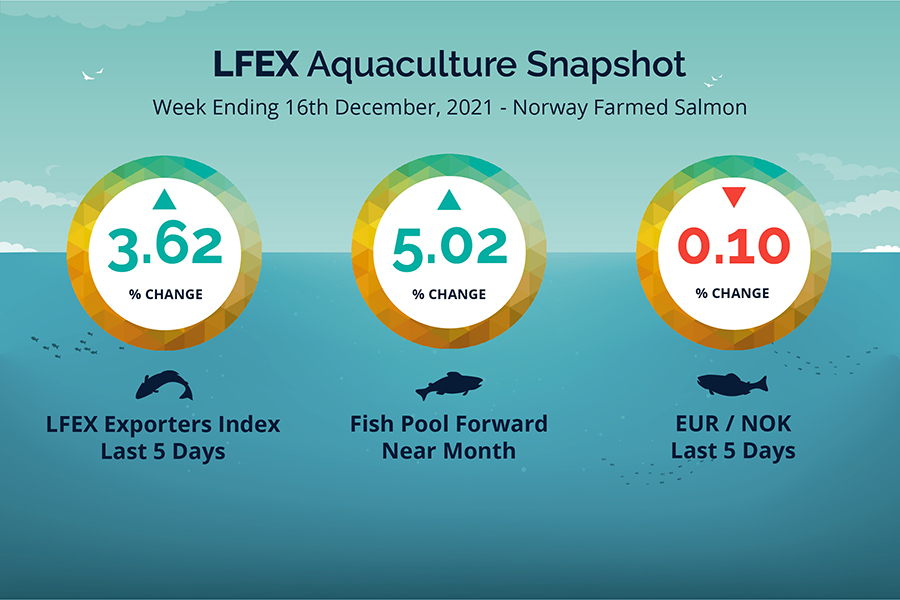
LFEX European Aquaculture Snapshot to 16th December, 2021
|
|
Published: 17th December 2021 This Article was Written by: John Ersser |
Market Insight – Europe
The market held onto its strong gains of last week with the LFEX Norwegian Exporters price up +3.62%, +2.64 NOK at 75.62 FCA Oslo Week 50 ending Thursday vs previous Thursday price.
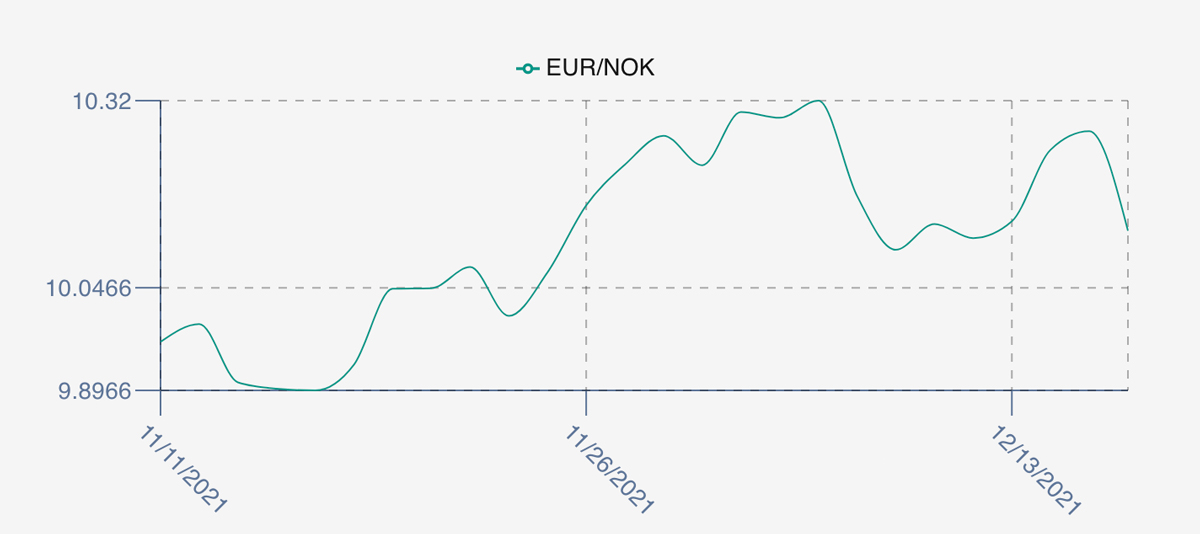
The NOK was broadly flat against the Euro at 10.13 down -0.01 NOK or -0.1% Thursday to Thursday and the Fish Pool future December increased +3.25 to 68 NOK or +5.02% over the same period.
Another week of rising prices opening 3% higher with good seasonal volumes and slight risk of weather restricting harvesting. Prices trickled up further to peak at 76.98 on Wednesday before the first signs of stability on Thursday with prices dropping 1.7% from Wednesday. The 3 – 6 spreads closed out around 3. See the comments below on the Index.
Market Data (Click Each to Expand)
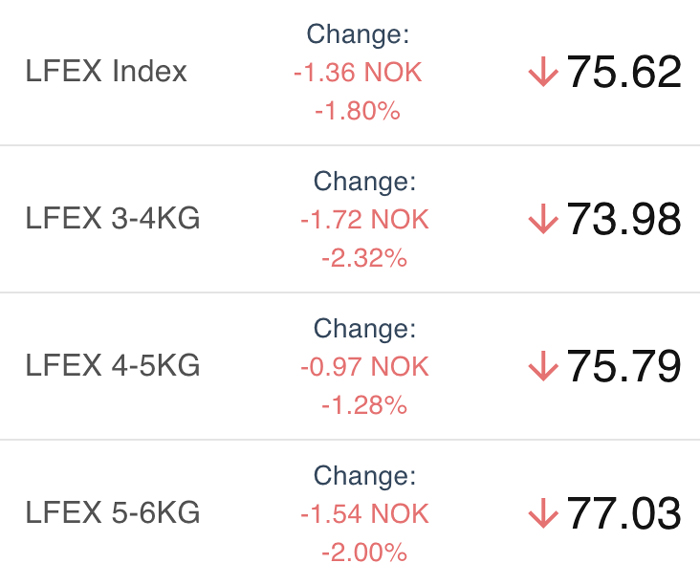
LFEX Prices
|
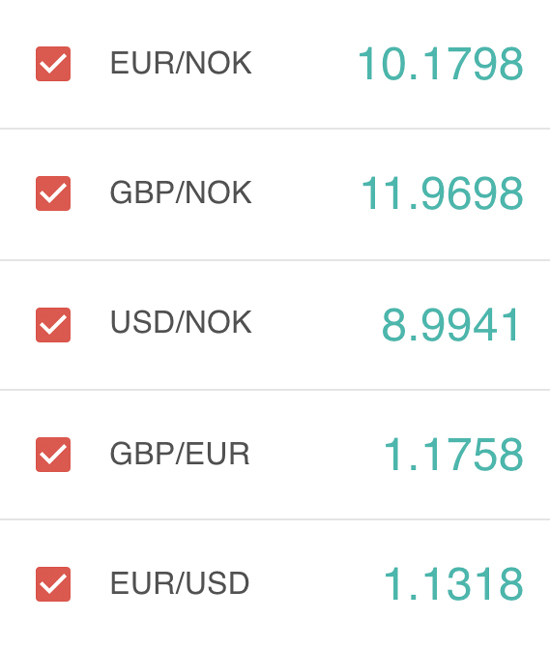
FX Rates
|
LFEX Indicative Exporter Prices (4 Week)
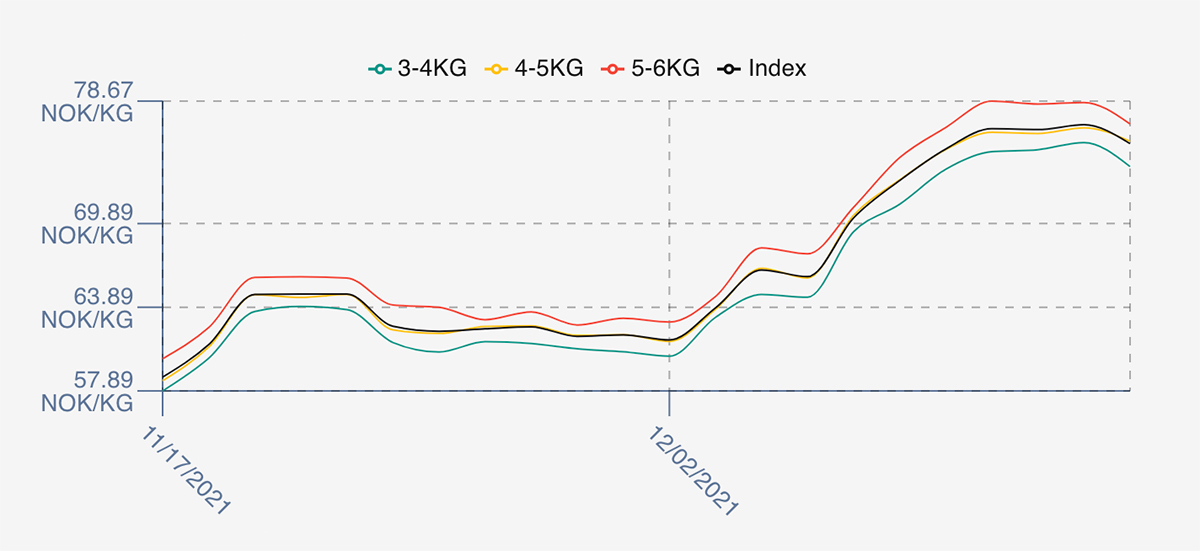
|
EUR / NOK FX Rate (4 Week)
|
|
Prices Ending 16th December, 2021 For Friday's Price For Next Week, Offers & Trading Please Register |
Did You Know?
The LFEX Exporters Index is priced every day and the only independent price index for Norwegian Salmon published daily.
The Index is the sellers price for 3 – 6 KG fish, which means the actual traded prices are generally lower (1 – 1.2%), and the index tracks volatility very accurately. If you want to know where the market is going intra-week you need to look at this index. It is also a good way to get a feel for the next weeks pricing by assessing the Thursday close. For example, in Week 49 the LFEX Index closed at 72.98, compared to Fridays (Week 50) open at 75.62 while NASDAQ showed a weekly average of 65.17 NOK for Week 49.
FAQ’s
Q. Why does your Index price differ from NASDAQ?
A. Our index as described above seeks to capture the daily price movements and give participants an accurate read of the actual market prices for the most actively traded weight classes. The NASDAQ Index accounts for all weight classes and is based on traded prices from the previous week and is a weighted averaged. Therefore, as happened in Week 49, the average traded prices were around 65 because a lot of the volume was traded early in week when prices were lower and is entirely correct.